Álvaro García
When purchasing corn grain, buyers consider multiple factors to ensure they acquire a product that meets their nutritional and economic needs. One critical indicator of corn quality is the relationship between protein and starch content. Starch is the primary energy source in corn, essential for livestock feed, while protein contributes to its overall nutritional profile. However, these two components are inversely related, which can impact both nutritional value and economic returns. Understanding this relationship helps buyers make more informed decisions. High-protein corn often correlates with lower starch content, potentially reducing its value as an energy source for livestock. Our analysis of corn data from 2020 to 2023 revealed a significant linear relationship between protein and starch. Recognizing this relationship allows buyers to evaluate the trade-offs and align their purchases with the specific nutritional requirements of their livestock. Furthermore, this insight can guide buyers in selecting corn varieties that maximize feed efficiency, leading to cost savings and improved productivity. In this article, we present a linear regression model that quantifies the relationship between protein and starch content in corn. This model serves as a valuable tool for predicting starch levels based on protein content, providing actionable insights for optimizing feed quality and cost.
Data Overview and Analysis
To explore this relationship, we used corn sample data from the years 2020 to 2023. The number of samples used in this analysis by year were as follows: 2020 (1,039 samples), 2021 (1,032 samples), 2022 (1,050 samples), and 2023 (1,016 samples) for a total of 4,137 analysis. The statistical analysis excluded any outliers to ensure a more accurate representation of the true relationship between protein and starch content. A linear regression model was applied to the data, resulting in the following prediction formula:
Starch= 78.8873 – 0.7966 x Protein
This equation suggests a negative linear relationship between protein and starch in corn, where an increase in protein content corresponds to a decrease in starch content. This inverse relationship aligns with the physiological makeup of corn kernels, where the allocation of nutrients often competes between protein and starch during the grain-filling phase.
Example 1. A corn buyer can use the formula above to estimate the starch content in corn. Let’s use for example a shipment offered with 8% protein. Plug the protein value into the formula such that:
- Starch = 78.8873 − 0.7966 × 8
- Multiply 0.7966 x 8 = 6.3728
- Strach% = 78.8873 − 6.3728 = 72.5 %
How is this important? Energy = 72.5 grams ×4 kcal/gram = 290.058 kcal or 2,900.58 megacalories (Mcal) per ton.
Example 2. A corn buyer can use the formula above to estimate the starch content in corn. Let’s use, for example, a shipment offered with 9% protein. Following the exact same calculations he will be purchasing 2,868.72 megacalories (Mcal) per ton.
How reliable is the model?
The model’s R2, which indicates the proportion of variance in starch content explained by the protein content, was found to be approximately 0.645. This means that around 64.5% of the variability in starch content can be attributed to changes in protein content for the 2020–2023 dataset. While this is a strong relationship, it also implies that other factors, such as environmental conditions, genetics, and agricultural practices, play a role in determining the starch content in corn.
To better visualize this relationship, the scatter plot below illustrates the data points for protein and starch content, along with the linear regression line that models their relationship. The negative slope of the line confirms the inverse correlation between protein and starch in the analyzed corn samples.
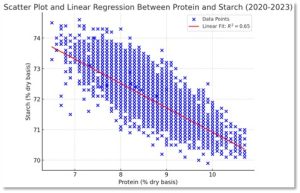
The graph clearly shows that as protein content increases, starch content decreases aligning with the regression model’s prediction. This visual representation further strengthens the conclusion that there is an inverse relationship between these two key components of corn.
Interpretation and Implications
The negative coefficient in the prediction formula (-0.7966) highlights that as protein levels increase, starch content tends to decrease. This relationship can be important for producers aiming to balance the nutritional profile of corn-based feeds. For instance, poultry nutritionists often seek to optimize the starch content in rations to maximize energy intake, while also considering the protein needs for overall health and milk production. By understanding this trade-off between protein and starch content in corn buyers can make more informed decisions regarding their purchases.
This linear regression analysis provides a clear and simple method to predict starch content based on protein levels in corn, using data from recent US harvest years. The resulting formula, with an R2 of 0.645, highlights the inverse relationship between these two components. While the model captures a significant portion of the variance in starch content, other factors must also be considered for a comprehensive understanding of corn’s nutritional composition.
Future research could explore additional variables or more complex models to further improve the prediction of starch content and better address the dynamic factors influencing corn’s nutritional quality. Nonetheless, the current analysis offers a practical tool for traders, producers, and nutritionists in optimizing corn’s use in various agricultural and food applications.
© 2025 Dellait Knowledge Center. All Rights Reserved.