Álvaro García
The Dellait Biometric Monitoring System (DBMS) is a Swiss-made, comprehensive monitoring solution that leads the market when it comes to remote cow tracking. The system monitors milking dairy cows as they walk in or out of the parlor, which typically happens 2-3 times a day, depending on your milking frequency. If you use a robotic milking system, cows are monitored each time they visit the unit, which can easily double the number of observations. Over a 305-day lactation, this translates in at least 610 monitoring instances per cow on a conventional milking routine, providing increased accuracy across all tracked parameters.
Currently, the DBMS dynamically assesses each cow’s body condition changes and, using built-in algorithms, accurately predicts both current body weight and weight changes over time as well as height in young growing heifers. Additionally, the system scores locomotion with every pass through the parlor, enabling early detection of any gait changes. This allows for timely intervention of lameness, improving treatment success while reducing drug usage, treatment duration, and associated costs.
Until recently, DBMS provided this data through numbers and graphs for users to interpret on their own and determine the best course of action. Now, with the integration of Artificial Intelligence, the system assists in diagnosing any issues and recommends the most effective intervention to improve the cow’s health. This enhancement translates into improved animal well-being and extended longevity for cows in the herd.
Practical farm example
When you first open the DBMS the first thing that appears in your screen is the image below. This is an example of an actual commercial farm that has been successfully using the system for quite some time.
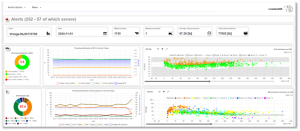
The first section shows the “Alerts,” indicating the cows flagged by the system for attention. There are currently 252 alerts in this farm, with 57 categorized as “severe.” This number may vary based on the customizable alert settings for your farm. For privacy, the farm name has been hidden, but your farm’s name would be displayed here. Following the alerts, the system shows the date, the total number of cows in milk (1,155), the measured animals (1 since it is individual cows), the average milk production per cow (67.36 lbs.), and the total milk produced that day (77,802 lbs.).
The following row is dedicated to body condition score (BCS), an essential indicator of the cows’ status. The BCS distribution is depicted in the center of the , in this case with an average of 3.5 which is ideal. The next section shows the distribution of this BCS in the herd with approximately 60% of the cows showing a BCS of 3.5 (green line) and around 30% over-conditioned (orange line). Over-conditioned cows, although fewer, will require close attention since excess body fat can result in metabolic disorders, calving difficulty, and reduced fertility. The next graph to the right in this row shows the graphical distribution of the BCS depicting what we just observed. In this graph the user can choose which group to observe by canceling with a click of the mouse the ones that are not of interest.
The final row of the report focuses on milk production metrics. The first circle displays the average milk yield per cow, at 67.4 lbs., with production ranges segmented in 22-pound increments (0–22 lbs., 22–44 lbs., etc.). This segmentation allows for a clear visualization of the distribution of milk production across the herd. The subsequent section presents the percentage distribution of milk production over the past 15 days, categorized in 44-pound intervals (0–44 lbs., 44–88 lbs., etc.). This breakdown indicates the proportion of cows falling within each production range. The system enables you to exclude specific groups and concentrate on those of particular interest, facilitating targeted analysis of production brackets. The final section of this row of the first page of the report examines milk production distribution relative to days in milk (DIM), illustrating that this herd exhibits a typical lactation curve. This curve is characterized by an initial increase in milk yield post-calving, reaching a peak, followed by a gradual decline as lactation progresses. Monitoring this distribution is crucial to identify cows that exceed expected production levels and assessing their lactation persistency. Persistency refers to a cow’s ability to maintain milk production after peak yield, which is vital for overall herd productivity. By analyzing these patterns, you can pinpoint high-performing cows and make informed decisions regarding management practices to enhance lactation performance across the herd.
Let’s focus on the section covering individual cows. Given the complexity and detail involved, we’ll conduct an analysis of a single cow. To handle the report’s extreme horizontal length, we’ve divided it into two parts, displaying only the data for the first three cows. Each cow’s parameters are color-coded: green (no issues), orange (monitor closely), and red (requires immediate attention). Out of the 1,155 cow entries, we’ll focus on cow number 1, which has a red alert on milk production (as shown in the second screenshot).
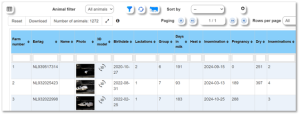
This cow, with farm number 1, is a 4-year-old, second-lactation cow with 191 days in milk. She had an issue in her previous lactation, as indicated by a prolonged dry period of 251 days. She was inseminated twice, with the last insemination on September 15, and has not shown any further inseminations since then, suggesting she could be pregnant. Now, let’s address the areas of concern. First is her body condition score (BCS), marked in ‘orange’ (monitor closely); her ideal BCS at this stage of lactation should be 2.98, but she is currently at 4.32.
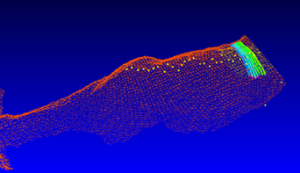
When cow number 1 walks under the 3D camera, her ID is immediately recognized via the RFID system, linking her identity to the camera’s data capture process. The 3D camera then captures a series of images from multiple angles. Using advanced algorithms, it processes these images into a dense cloud of data points (image below) that maps her body contours and key anatomical features. This detailed 3D model allows the system to accurately estimate her body condition, weight, and stature, providing precise, real-time measurements critical for monitoring her health.

Let’s now click on the BCS graph icon to examine her trend over time. Observing the evolution of the graphs, it’s clear that her lameness (green line) was inconsistent during the first 90 days in milk, with recurrences around 50 days in milk that coincided with significant drops in milk production (blue line). The vertical green dotted line marks her last insemination at 145 days in milk, and she was then confirmed pregnant at 192 days in milk (vertical red line). The delay in her pregnancy could be attributed to several factors. Firstly, the inconsistent lameness observed during the initial 90 days in milk likely impacted on her overall well-being and productivity, as shown by the corresponding drops in milk production around 50 days in milk. Lameness often affects a cow’s ability to move comfortably and can lead to stress, pain, and reduced feed intake, all of which can negatively influence reproductive performance. When a cow is dealing with lameness, the energy that would ideally support reproduction is instead directed toward managing the physical stress of the condition, which may delay conception.
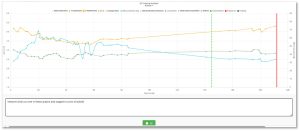
Furthermore, her body condition score (BCS) shows she lost weight in the first 60 days of the lactation as it could be expected, indicating that she may not have had an optimal energy balance to support the expression of estrus during her early lactation period.
In the AI box we can then write what we want to ask the system, in this case we typed: “Interpret what you see in these graphs and suggest course of action”, and then click the green button below the graph. Below is the response, since it is difficult to read because of the font size we copied and pasted the AI recommendations in the text box further down. An important feature of the system is that response can be delivered in nearly 80 different languages, depending on the user’s preference.
Analysis of Dairy Cow Data
Milk Production
The milk production data shows an initial increase from 31.63 kg on April 25 to a peak around 68.59 kg on May 13, then steadily declined to around mid-30 kg by the end of October. This rise and fall in production is typical as the cow progresses through its lactation period.
Body Condition Score (BCS)
The BCS starts at 4.2 and shows fluctuations throughout the observed period. There is a noticeable decline around the mid-period as the BCS dips to 3.34, then gradually increases back to a higher level of around 4.32 towards the end. This suggests some loss and recovery in body condition, possibly due to metabolic demands associated with milk production.
Locomotion Score
The locomotion scores are variable, ranging from 2.3 to 3.5. Fluctuations in locomotion may indicate temporary issues related to hoof health or discomfort. The scores are relatively stable and do not indicate severe lameness (scores above 4).
Suggested Course of Action
Milk Production
As the cow’s peak milk production is followed by a natural decline, ensure that the diet is adjusted to prevent excessive weight loss as lactation progresses. Emphasize balanced nutrition to support energy needs.
Body Condition Score
The BCS variations suggest the need to monitor and adjust feed intake to maintain optimal body condition, particularly during high production phases. Ensure that the cow has access to high-quality forages and concentrates to meet the heightened nutritional needs.
Locomotion Score
Regularly inspect the cow for any signs of lameness or hoof issues. Implement a hoof care program, including preventive trimming and providing clean, dry bedding to minimize locomotion issues.
Overall, maintain vigilant monitoring of the cow’s condition through regular health checks, nutritional monitoring, and management adjustments to address any fluctuations in performance indicators. Address potential stressors that could negatively impact milk yield or body condition.
In conclusion, DBMS not only improves individual cow management through real-time data but also contributes to better herd health and productivity through early detection. The system is instrumental in optimizing dairy farms by providing actionable items, improving efficiency, and supporting animal well-being. Its primary benefits are:
- Precision Monitoring with High Frequency: The system provides frequent and detailed monitoring, with at least 610 check-ins per cow during a standard 305-day lactation. This high level of observation allows for more accurate information about each cow.
- Dynamic Body Condition and Weight Tracking: Tracking and predicting body weight, BCS, and growth is essential to monitor cows’ performance. A high BCS, for instance, may indicate risks for metabolic disorders, which the DBMS helps detect early.
- Locomotion Scoring for Lameness Prevention: The DBMS can identify subtle gait changes that might signal hoof or lameness issues. Timely intervention reduces treatment costs, limits drug use, and helps maintain comfort, ultimately improving productivity.
- Artificial Intelligence for Decision Support: The AI component assists farmers by interpreting the data and suggesting the most appropriate interventions. This feature enhances the system’s value, as it reduces the burden to manually analyze complex data.
- Visualization of Herd-Wide Metrics: The DBMS provides clear, color-coded visuals of critical metrics like BCS and milk production that deviate from those desired, helping farm managers quickly identify cows needing attention.
© 2025 Dellait Knowledge Center. All Rights Reserved.