Álvaro García
The projected global population surge to 9.5 billion by 2050 and the ensuing escalated meat demand, driven by rising income and urbanization (FAO, 2020), has prompted significant meat exports from the US. According to Uffer (2023), in 2021 alone the US witnessed substantial meat exports, tallying approximately $54.3 billion, directed primarily to East Asian markets, signaling a remarkable surge in the industry’s growth. Notably, US beef exports soared to a record $11.68 billion in 2022, marking a remarkable 10% increase from the previous year (USMEF, 2023). However, this escalating demand poses significant challenges to the livestock production sector, including labor shortages, disease management, and individual animal monitoring.
Precision Livestock Farming (PLF) stands as a promising solution to tackle the hurdles in beef feedlot production by integrating sophisticated technologies for effective management. Manual observations, which currently dictate feed delivery decisions and daily intake assessments, are labor-intensive and subjective, often leading to errors due to skill variations among workers. This scenario, coupled with labor shortages in rural areas, necessitates a shift toward technology adoption for sustainable feedlot operations. Sensing technologies within Precision Livestock Farming, especially imaging technology, emerge as potential solutions. While these imaging systems have seen extensive use in autonomous vehicles, industrial design, and entertainment, their application in agricultural settings, particularly in managing livestock, remains relatively unexplored.
Studies have demonstrated the potential of depth cameras (3D) in livestock industries, showcasing their accuracy in measuring pig dimensions and estimating dairy cow feed intake. However, applying such technologies to beef cattle feedlots, considering diverse meal textures and sizes, is an area that requires further exploration.
Application of depth imaging in feedlot management
A recent study conducted at the University of Nebraska employed a cost-effective depth imaging system to quantify residual feed in concrete feed bunks. The objectives encompassed acquiring, processing, and analyzing depth images to predict residual feed weight accurately, intending to evaluate the depth camera’s accuracy in estimating remaining feed. The study unfolded an innovative approach to optimize feedlot efficiency, emphasizing technology’s potential to revolutionize feed management practices.
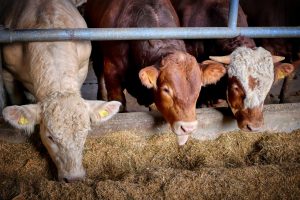
The 3D camera used featured a one-megapixel (MP) depth sensor with both wide and narrow field of view options, complemented by a 12 MP red-green-blue (RGB) video camera, improving depth stream alignment and sensor orientation. The camera was positioned 1 meter above a fence-line feed bunk to observe a two-foot (0.61m) bunk section. Ensuring the camera was at least one meter from the bunk base, the camera was centered within the bunk’s field of view before image collection. The bunk used was a 0.61m section of a concrete feed bunk (a) with cardboard taped to the bunk sides to replicate feedlots. Eleven common feed ingredients (such as dry rolled corn, high moisture corn, steam flaked corn, dried distiller’s grains (DDGs), modified distiller’s grains (MDGS), sweet bran, alfalfa hay, corn silage, corn stalks, wheat straw) prevalent in Midwest feedlots were used for the experiment.
The feeds were classified as concentrate or forage based on visual texture, further categorized into ingredients or diets. Concentrate ingredients and diets were primarily grain-focused, encompassing dry rolled corn, high moisture corn, steam flaked corn, dried distiller’s grains, modified distiller’s grains, and sweet bran. Meanwhile, forage ingredients and diets featured alfalfa hay, corn silage, corn stalks, wheat straw, and grass hay.
Camera calibration and image analysis
To calibrate the camera depth images of three-square boards at varying distances from the camera and across different positions in the field of view were captured. The dimensions in pixels from these depth images were measured and then the ratio was calculated between the measured pixel dimensions and the actual dimensions in millimeters. These ratios formed the basis for developing calibration equations for both length and area dimensions.
The results revealed that square boards positioned at the center of the camera’s field of view were most accurately captured. Different positions—center, vertical edge, horizontal edge, and corner edge—displayed varying pixel-to-length and pixel-to-area ratios. Notably, the center and vertical edge positions demonstrated relatively similar ratios, whereas larger differences were observed for the horizontal and corner edges compared to the center and vertical edges. Furthermore, the study noted that boards of smaller dimensions exhibited more distortion in the images and were less effectively captured by the camera. The 10×10 cm square board showed the highest standard deviations for length and area ratios compared to the larger board sizes. Conversely, the 30×30 cm square board displayed the smallest deviations, indicating better image consistency for larger dimensions.
Additionally, the study found that greater distances from the camera resulted in less variation in dimension sizes compared to images taken closer to the camera. Distances of 100 cm, 150 cm, 200 cm, 250 cm, and 300 cm showed varying length and area ratios, with the greatest standard deviations observed at the closest distance (100 cm) and the lowest at the farthest distance (300 cm). This highlighted the impact of distance on the accuracy and consistency of captured dimensions.
Findings and predictive insights
The study employed a depth imaging technique to estimate the residual weights of eleven common ingredients. Notably, forage ingredients, characterized by higher bulk densities, showed better predictability by the model. Among forage ingredients, wheat straws, with a bulk density of 42 kg/m³, displayed the highest magnitude error, while alfalfa hay showcased the lowest margin of error.
Interestingly, the model tended to overestimate the residual weights of certain ingredients like corn silage and dried distillers’ grains, potentially due to the physical properties of the feed type and distortions in the segmented images. Forage ingredients, especially those with dust and mold during image collection, encountered depth image information issues. Similarly, concentrate ingredients with textures resembling the feed bunk experienced poor segmented edges, impacting volume estimation due to missing or inaccurate pixel values.
The model generally performed better in estimating residual weights of concentrate ingredients than forage ingredients. Concentrate ingredients, particularly those with increased bulk densities, exhibited more accurate predictions, highlighting the influence of bulk density on predictive accuracy. Conversely, forage ingredients, being bulkier with lower compaction between feed particles, showed more variability in predictive performance.
The analysis revealed interesting insights when it comes to diets. Concentrate diets generally performed better, exhibiting a lower margin of error compared to forage diets. Among the concentrate diets, those with higher bulk densities, like Corn + MDGS with stalks, displayed superior accuracy in predictions, while diets with bulk densities like Corn + MDGS with silage demonstrated higher errors.
For forage diets, the model faced more challenges, with higher average errors observed across the board. Grass + MDGS presented substantial errors in predictions, indicating limitations in estimating residual weights for such diets. Comparing this study’s results with previous ones, similarities in error ranges were noted, affirming the potential of the proposed method using depth cameras and imaging techniques. However, it’s essential to acknowledge environmental influences like rain, sunlight, and temperature, which can impact the accuracy of residual feed weight estimations. For instance, forage feeds are susceptible to drying faster in hot and dry conditions, reducing their weight due to increased dust production. Additionally, feeds with high moisture content, like corn silage, are prone to spoilage when exposed to ambient conditions for prolonged periods. These environmental factors must be considered when leveraging technology or novel imaging methods for accurate feed weight estimation models. They present challenges that need to be addressed to enhance the precision of such predictive models.
Ultimately, the study concluded that the model excelled in predicting the residual weights of concentrate ingredients with higher bulk densities, while forage ingredients with lower bulk densities presented more challenges for accurate predictions. For forage ingredients, the model predicted weights with an average error of 1.33 kg, a mean squared error of 2.85 kg², and an average error rate of 34%. Meanwhile, concentrate ingredients had an average error of 2.28 kg, a mean squared error of 8.54 kg², and an error rate of 20%. In terms of diets, concentrate diets averaged an error of 1.06 kg, a mean squared error of 1.72 kg², and an error rate of 12%. Forage diets, on the other hand, averaged an error of 1.3 kg, a mean squared error of 2.19 kg², and an error rate of 35%. The model performed best on well-defined depth images, showcasing its potential to estimate leftover feed in feedlot bunks using low-cost depth cameras. This method presents an alternative approach to assist feedlot workers in making more precise decisions about bunk management.
© 2025 Dellait Knowledge Center. All Rights Reserved.