Joaquin Ventura & Fernando Diaz
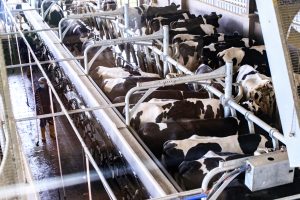
Milk produced by cattle makes up between 4 and 19% of the protein in the human diet, depending on the region of the world. It contains several essential nutrients for humans such as calcium, vitamins and essential amino acids. In addition, dairy beef produces a highly significant portion of the total beef protein that becomes part of our diet.
Contrasting with this data that shows the importance of dairy cattle in the production of quality food for humans, cattle farming has also been identified for a few years now as a significant contributor to greenhouse gases (GHGs), along with the rest of the agricultural sector. Although the actual amount of greenhouse gases emitted by agriculture and livestock are relatively low compared to those of other sectors (Figure 1), both activities have maintained a sustained effort to reduce their CO2, methane, N2O, and other pollutant emissions.
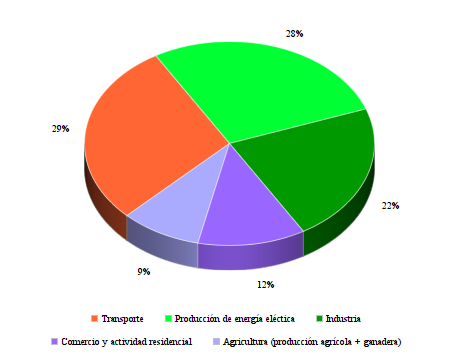
Figure 1. Greenhouse Gas Emissions (GHGs) from the agricultural sector in the US (source: Inventory of U.S. Greenhouse Gas Emissions and Sinks, 2017).
In an effort for the livestock sector to minimize its contribution to global greenhouse gas production as much as possible, a study was conducted in New Zealand and published in the Journal of Dairy Science in January 2020. The authors observed a trend over time in the carbon footprint of milk produced in New Zealand by the cooperative Fonterra group.
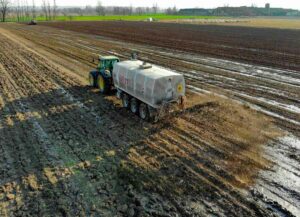
Emissions from all activities directly or indirectly related to dairy production were included in the calculation of the milk carbon footprint, from growing animal feed to the time when milk left the farm. The data collected covered the period between 2010 and 2018 and included farms from all over New Zealand.
The main results obtained were:
- The average annual carbon footprint of milk was 0.75-0.81 kg CO2 equivalent/kg milk corrected for fat and protein. The proportion to which each production item contributed are detailed in Table 1.
Table 1. Main sources of CO2 equivalent emissions on the dairy farms evaluated
| Factor | Parcent of total |
| Total CH4 produced by animals | 69-71 % |
| – Enteric CH4 by cows in production | – 85-86 % |
| – Enteric CH4 by replacement animals | – 12-13 % |
| – CH4 from excreta | – 1-2 % |
| N2O emissions | 15-16 % |
| – N2O from excreta | – 61-63 % |
| – N2O from crop fertilization | – 20-21 % |
| CO2 Emissions | 14-15 % |
| – CO2 procedente de la producción de alimentos para las vacas | – 4-12 % |
| – CO2 from non-nitrogen fertilizers | – 4-12 % |
| – CO2 from CaO used as soil fertilizer amendments | – 4-12 % |
| – CO2 from the production of N fertilizers | – 4-12 % |
| – CO2 from the production of electricity used in the farm | – 4-12 % |
| – CO2 from the diesel used in farming activities | – 3-4 % |
- The carbon footprint of milk produced was similar in farms across New Zealand. It was however slightly higher in the Northern region (maximum of 0.90 kg of CO2 eq/kg of milk corrected for fat and protein in 2011/2012 vs. a maximum of 0.84 kg of CO2 eq/kg of milk corrected in fat and protein in 2012/2013 from the other regions), an increase associated with lower milk production per cow.
- Factors such as drought had a major influence on CO2 production, such as in the Taranaki region in 2017/2018, a season in which it soared to 0.83 kg CO2 eq/kg milk corrected in fat and protein from 0.75 of the previous season.
- The carbon footprint of milk produced per head for farms included in the highest-production quartile was 15% lower than in farms of the lowest-production quartile. This difference was mainly associated with a decrease in methane emissions and was determined by 71% higher milk production per head on farms in the upper quartile, compared to those in the lower quartile, so that each kg of milk was produced much more efficiently.
- The ratio of carbon footprint increased per kg of milk produced in this study to periods of drought, with less feed availability in pastures. Data collected in previous studies (Lorenz et, 2019; Chobtang et al., 2017) point out that the higher the proportion of feed cows graze directly from pasture, the lower the carbon footprint of the milk produced.
Conclusions
Milk on the most productive farms had a 15% lower carbon footprint than farms with less production per head. Although overall emissions were higher per animal, this was offset by increased production, so that the kg of CO2eq decreased per kg of milk produced. According to the authors, this shows that by a proper management that allows to increase the productivity of the herd, the carbon footprint of milk production can be improved.
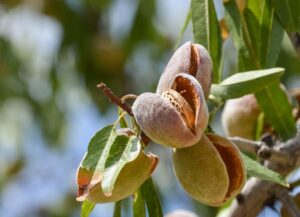
Milk’s carbon footprint could be further reduced by using low carbon footprint ingredients for feed production and optimizing nitrogen fertilizer in the fields where these ingredients and grass are produced.
Focusing on the New Zealand cow’s milk production model, this one has a lower carbon footprint per kg of milk produced than in other countries where the production model is more intensive (0.75-0.81 kg CO2 eq/kg milk vs. 1.1-2.1 kg CO2 eq/kg milk, according to Vries et al.,2019). The key factor is a feeding system based on a much higher proportion of grass consumed directly by the cows than in the rest of the world, with low use of concentrates; it also has a significant influence on a lower need for animal replacements.
References
- United States Environmental Protection Agency. Inventory of U.S. Greenhouse Gas Emissions and Sinks. https://www.epa.gov/ghgemissions/inventory-us-greenhouse-gas-emissions-and-sinks (01/02/2020).
- F. Ledgard, S. J. Falconer, R. Abercrombie, G. Philip, and J. P. Hill. 2020. Temporal, spatial, and management variability in the carbon footprint of New Zealand milk. Journal of Dairy Science. 103:1031-1046.
- De Vries, M. et al. 2019. Entry Points for Reduction of Greenhouse Gas Emissions in Small-Scale Dairy Farms: Looking Beyond Milk Yield Increase. Frontiers in Sustainable Food Systems, 3:49.
© 2020 Dairy Research Review. All Rights Reserved.