Andrés Haro
Water scarcity is one of the most important problems affecting sustainable development today. Increased demand for agricultural and livestock products can overburden freshwater resources needed to sustain that production.
An important indicator of sustainability is the assessment of the water footprint in both sectors. The water footprint concept refers to the volume of fresh water needed to generate a product that is measured throughout the entire production chain of that item.
The assessment of the water footprint of livestock production systems has created the need to quantify the utilization of this resource, to establish management measures in the sectors with high demand for raw materials such as dairy farming. Therefore, increasing the efficiency of water usage in the dairy production sector will improve the sustainability of the livestock systems and minimize potential impacts on water resources.
In a recent study, Ibidhi et al., (2020) determined the water footprint and economic productivity of livestock production systems, to improve the optimization of vital liquid. The researchers worked with eight dairy farms located in northwestern Tunisia.
Water use was monitored between 2015 and 2016 over an average production area of 383 ha, to measure water footprint and the economy of water utilization. Water volumes for each farm were evaluated by devices installed at irrigation points, consumption, milk cooling, cooling of animals in the summer, and service waters (used to clean the farm, animals and keep the environment clean).
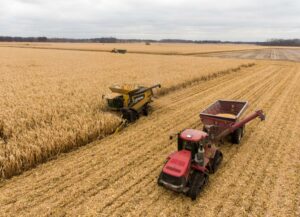
Forages were the main crops produced on each farm and were sampled for dry matter (DM) content. Milk production corrected for 4.0% fat and 3.3% protein was measured daily per cow throughout their lactation for each farm.
Water footprint of crops
The results showed that the volume of water consumed differed by forage species. The average volume of water used in ryegrass (5,982 m3/ha) was greater than that of maize, sorghum, oats, alfalfa, and triticale (averages: 5,157, 4,970, 4,002, 5,769 and 3,272 m3/ha, respectively).
Great variability was also observed in the forage DM produced by forage species which in the case of alfalfa ranged from 8,000-13,400 kg/ha. This marked variation in water use and DM production between farms could be explained by differences in irrigation volumes and the length of each forage vegetative cycle.
Moreover, the water footprint was higher for oats (2.1 m3/kg MS) compared to maize, sorghum, ryegrass, alfalfa, and triticale (0.9, 1.2, 1.6, 0.6 and 0.6 m3/kg of DM, respectively).
Water footprint for drinking, milking and cleaning
Cows in lactation consumed the most water (1,737 m3/year) while calves (22 m3/year) and heifers (247 m3/year) the least. The proportion of drinking water consumed was 3.75% of the total water footprint of milk. However, service water, which is mainly used during milking, cleaning, and cooling of animals, accounted for 9% of the total water usage, with wide differences between farms (ranging from 7 to 12%).
Water footprint and milk productivity
The total water footprint by volume (including water used for feed production, drinking water, and water for service and cleaning) showed that for each 1 kg of fat and protein corrected milk produced in all eight dairy farms, water usage was on average 1.36 m3.
As part of this study, the authors compared three different scenarios to assess how the change in feed, the location of feed sources and the consumption of service water affected the water footprint of milk:
- Use of triticale silage (without irrigation) to replace corn silage, sorghum, and ryegrass.
- Reduced water waste dedicated to milking, cooling, cleaning, and maintenance by 56%.
- Use of concentrates (corn and soybean meal) imported from Brazil and Argentina.
The results showed that increasing the use of triticale can reduce the water footprint of milk and water by 11%; wasting less service water reduced its footprint by 4%; and importing concentrates can reduce the water footprint by 16% (always relative to the baseline, i.e. the average DM in the feed fed to the animals on the farm). These alternatives could all have helped reduce water consumption on the farms in this study.
Conclusions
- The average water footprint of 1 kg of fat and protein corrected milk was 1.36 m3/kg.
- Most of the water (87%) went to feed production, but many of the crops are usually over-irrigated so the water footprint can improve if the irrigation efficiency is improved.
- Drinking and cleaning water accounted for 3.7% and 9.0%, respectively of the total water footprint.
- Concentratesthat need less water or the importation of feed from countries where their water consumption is low could reduce water usage for milk production by up to 16%.
The authors noted that future efforts should be directed towards integrating the water footprint of milk production with other indicators (carbon footprint, energy, etc.) to have an overall perspective of the sector’s impact on the environment.
Reference
Ibidhi, R., Salem, H.B. 2020. Water footprint and economic water productivity assessment of eight dairy cattle farms based on field measurement. Animal. 14(1): 180-189.
© 2021 Dairy Knowledge Center. All Rights Reserved.